Visualisation
March 2019
This project explored the use of visualisation techniques to allow for data analysis, extraction, filtering, and knowledge discovery, presented in a user-friendly interface. The dataset to be visualised was the MovieLens dataset. This dataset contains the following information about movies:
- title
- year of release
- genre
- tags (such as atmospheric, or big-budget)
The dataset also contained data about reviews for each movie.
- How to use a python visualisation library (VTK), along with a popular data processing library (Pandas) to handle and manipulate data
- How to design useful visualisations to see as much information as possible from a set of data
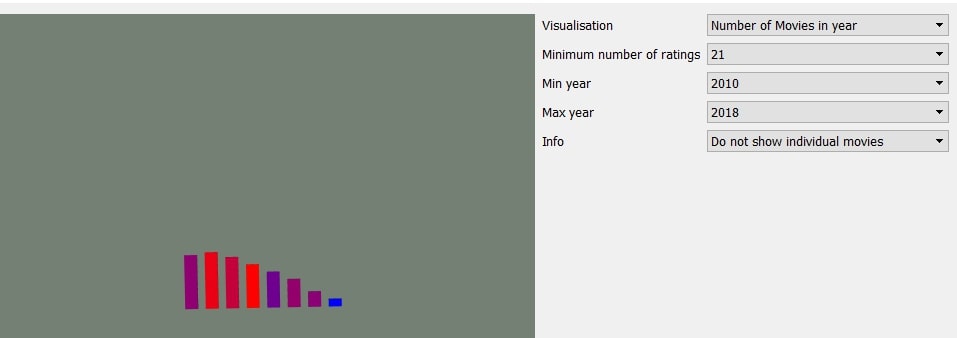
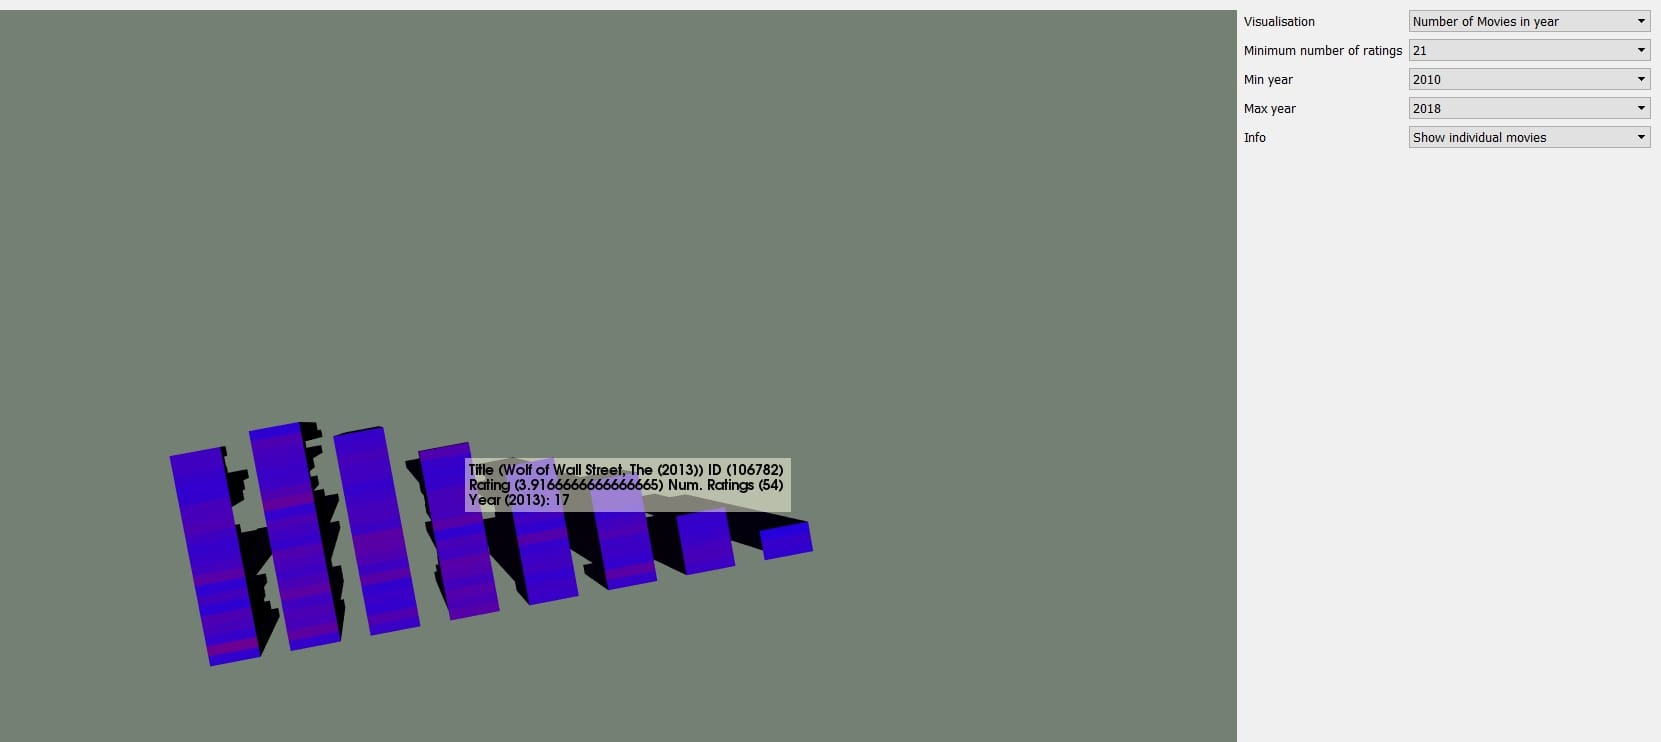
Visualising Movies By Year
The first page in the application shows the number of movies released in each year, along with other information such as the average rating of movies in a specific year. There are options to change how the information is displayed.
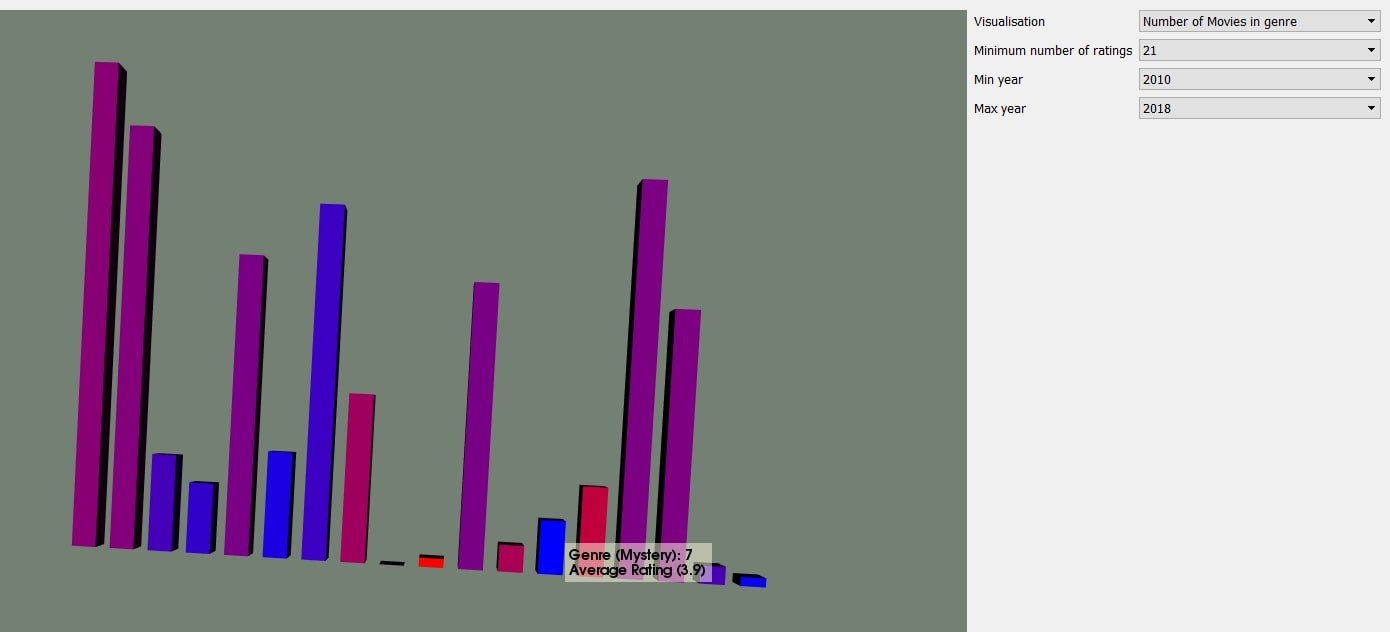
Visualising Movies By Genre
The second page in the application shows the number of movies in each genre, along with other information such as the average rating of movies in a specific genre. Again, there are options to change how the information is displayed.
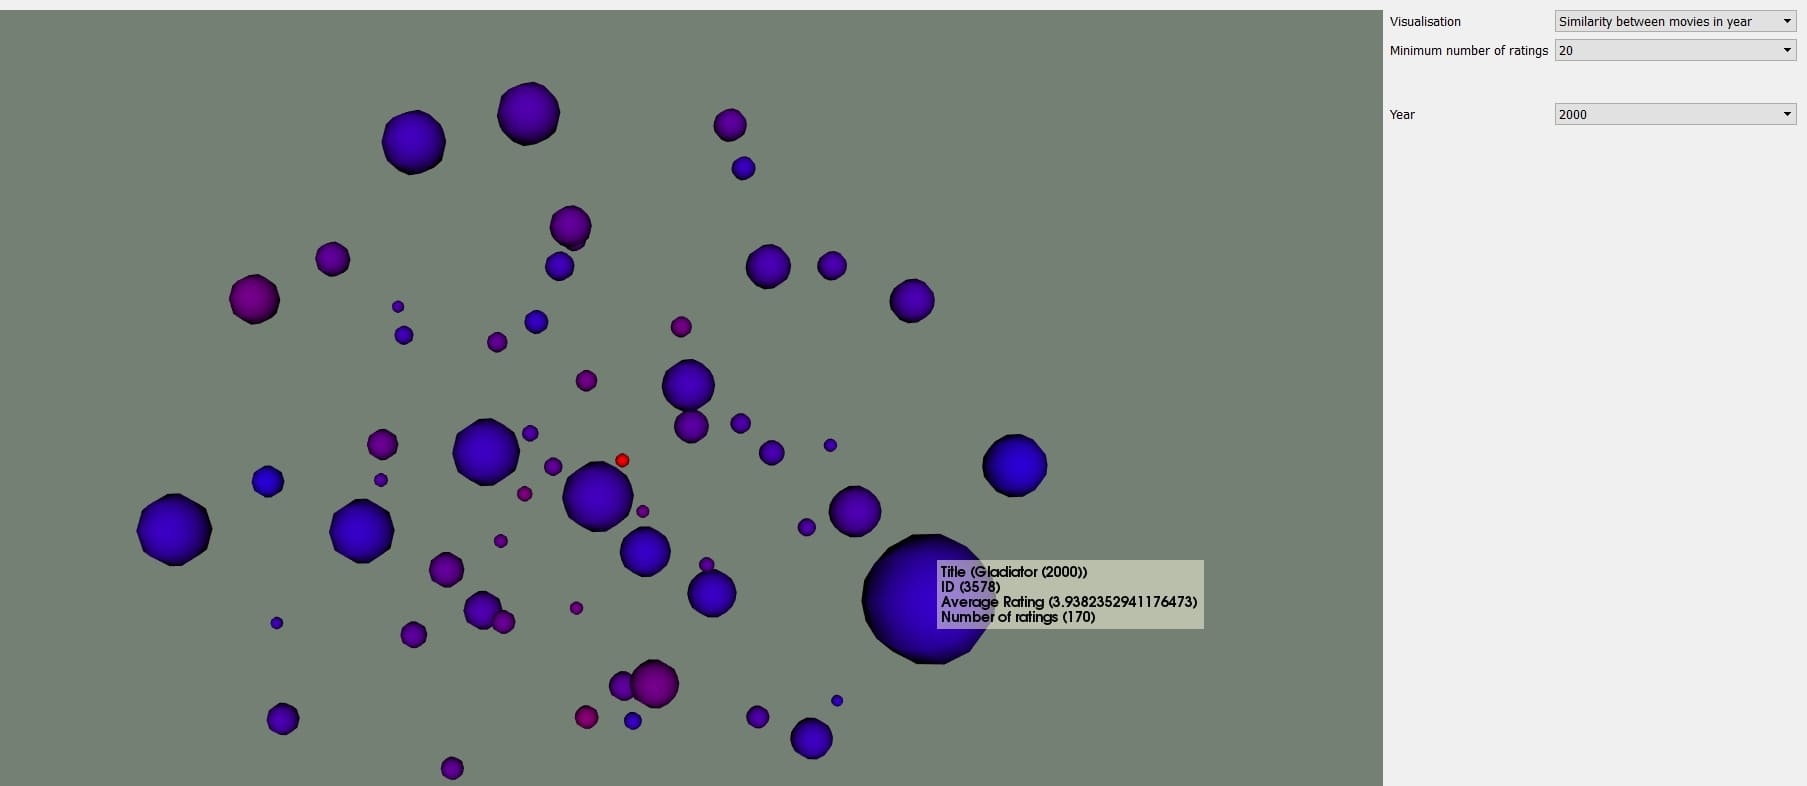
Visualising Similarities Between Movies
The final page in the application shows a 3D plot of movies in a specific year range; this aims to show average ratings, number of ratings, and similarity between movies in one plot. The similarities were calculated using TSNE on the ratings for each movie.