Graphics - Bezier Surfaces
December 2018
PYTHON
What I Learnt:
- How to use theoretical principles and knowledge to guide a practical implementation
- How to use a Python library with very little documentation
- How to create simple graphics
2D Graphics
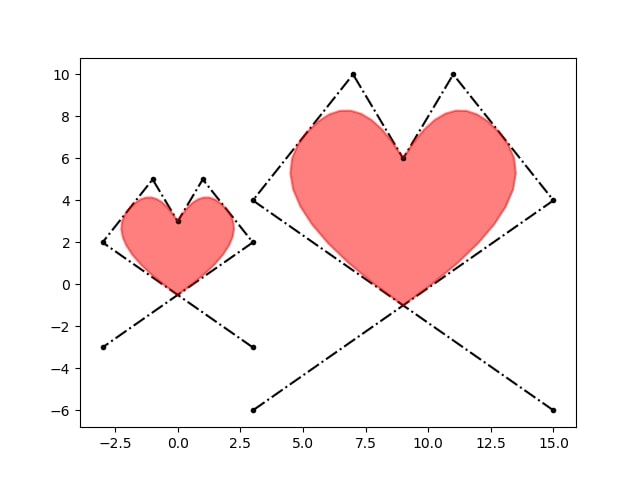
The first part of the project involves using 2D B-Spline Curves to create a heart shape.
- The first drawing shows two hearts, of different scales, generated by manipulating control points of a B-Spline curve, as explained here
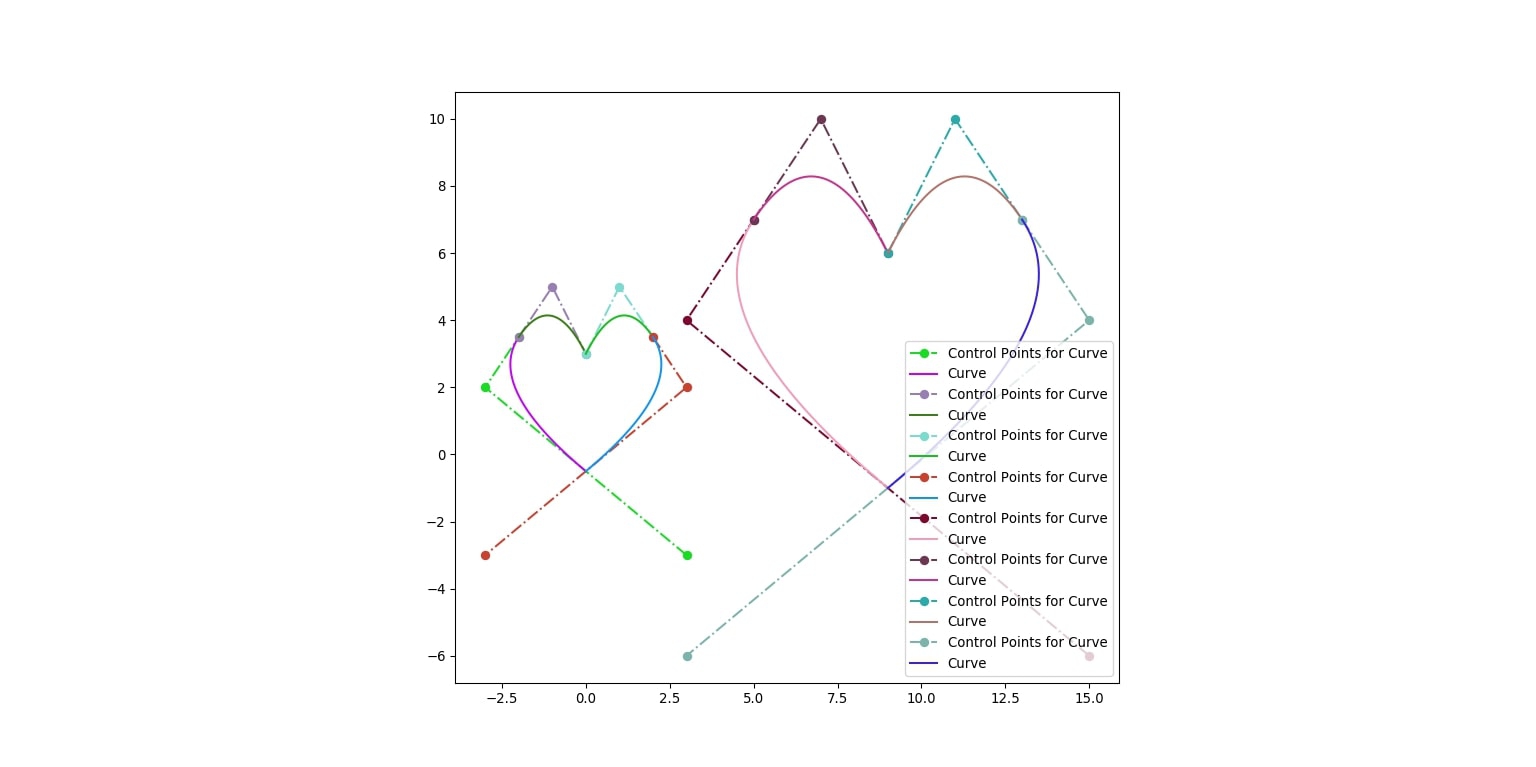
- The second drawing shows the B-spline curves decomposed into their Bezier curve components.
3D Graphics
This section shows the use of B-Spline and Bezier surfaces to create a 3D landscape of mountains and valleys. Addionally, an adpative approach is shown to render the landscape with different levels of detail.
The adaptive approach is as follows:
- Split the surface into blocks of smaller surfaces
- Calculate the second derivative of each of the smaller surface blocks: this should give a high value for surfaces that change a lot (i.e are curved) and low values for surfaces that are flat
- Sample points from each surface block, using fewer samples for surface blocks with a small second derivative and more samples for surface blocks with a greater second derivative (i.e use more samples on features that need it).
- Evaluate each of the surface blocks to generate a set of evaluation points
- Plot the original surface using these evaluation points
Examples:
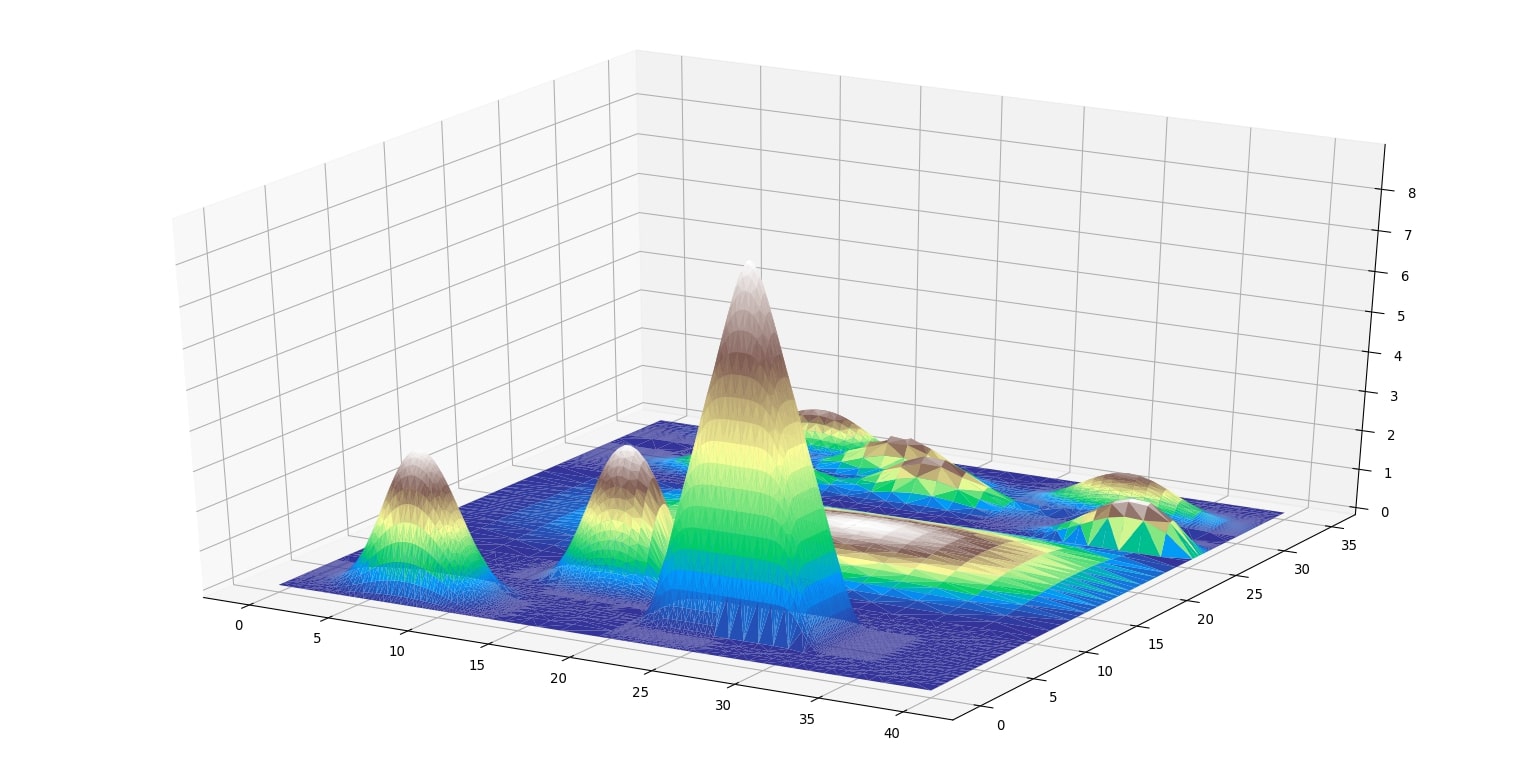
Landscape drawn with Level-Of-Detail set to 1
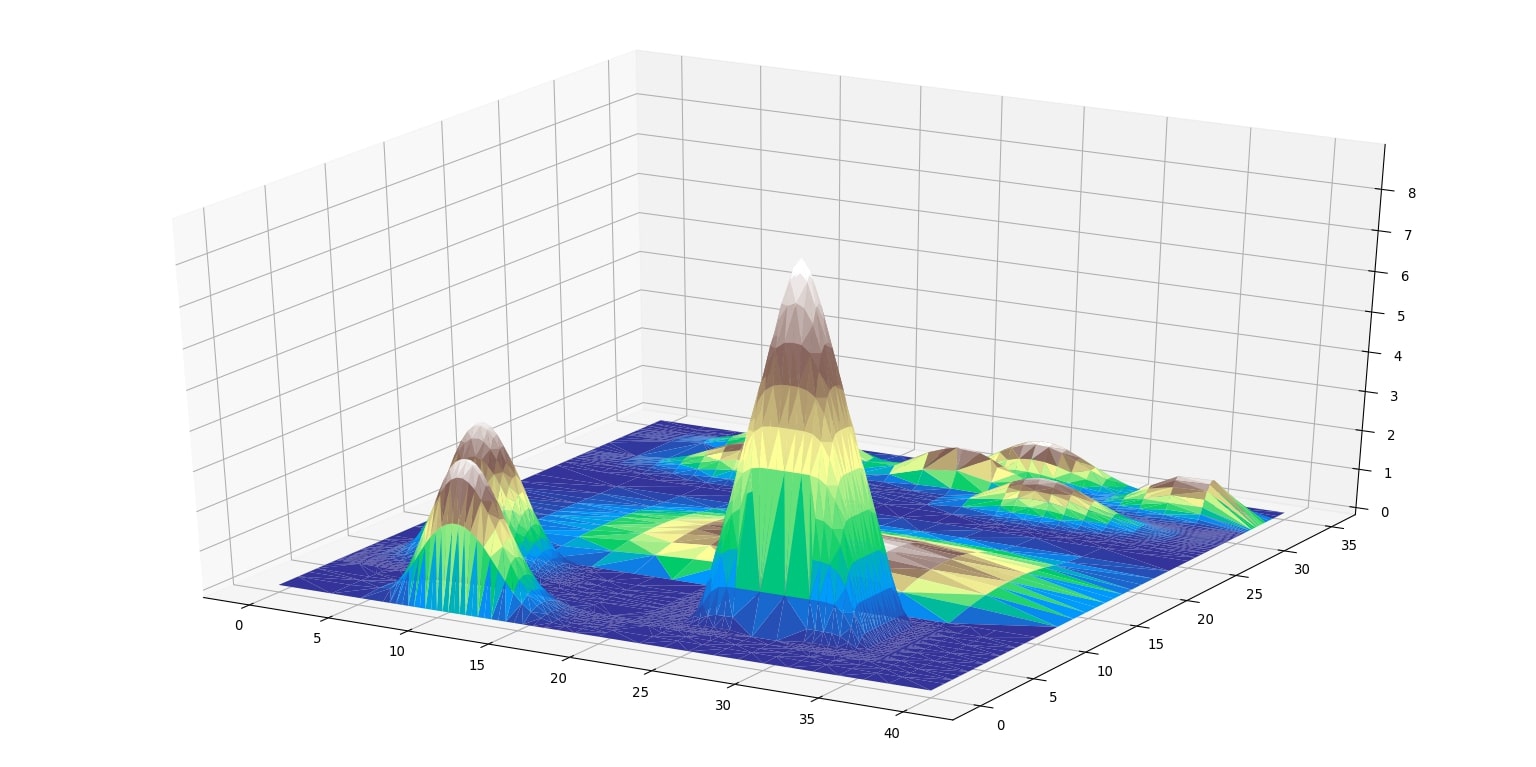
Front View
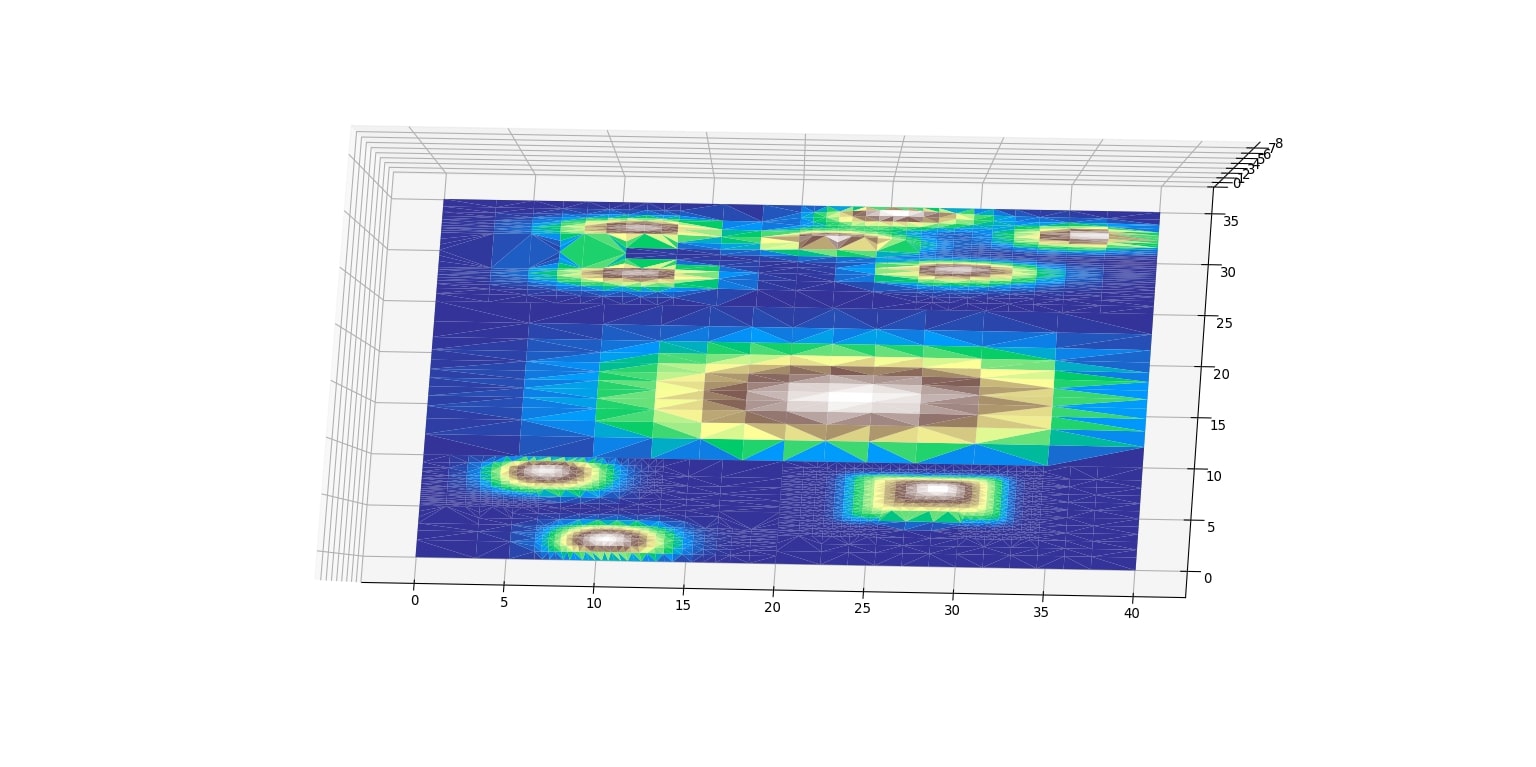
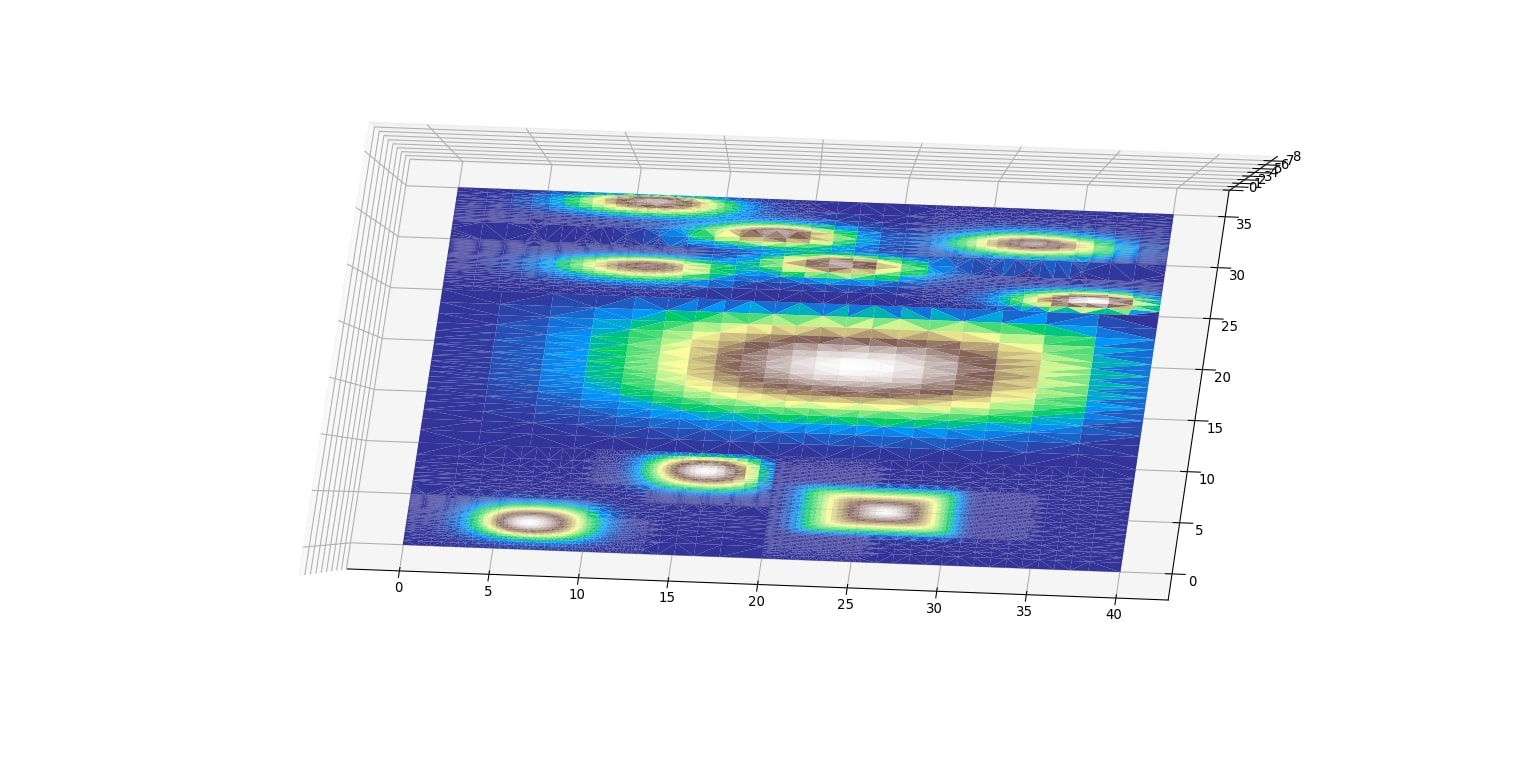
Top-Down View
Note the differing number of triangles drawn in areas of high change (i.e slopes) versus areas of low change (i.e plains)
Landscape drawn with Level-Of-Detail set to 3; note how this is more detailed than the landscape drawn with Level-Of-Detail set to 1 as it uses more triangles to draw the scene
×
![]()